AUTEURS

Alessandro Volpe
Lead Data Scientist &
Experience Mining Expert
@Bip xTech
Evaluating and measuring the customer experience of a company is not easy. Finding an objective measurement for the Customer Experience is impossible, however it is possible to define indicators that can offer an approximate estimate of its quality.
If a totally quantitative approach to measuring experience is not achievable, a totally qualitative approach would be equally fallacious. It is therefore preferable to adopt a mixed qualitative-quantitative approach, derived from the social sciences and common to the analysis of many complex phenomena.
What is traditionally carried out is a partial evaluation of some critical moments (pain points) of the Customer Journey, those that emerge from Research activities. The real strength of such a method is the ability to estimate the quality of the experience, interpret behaviors and understand the causes that generate them so that actions can be designed that are relevant to end customers and their experience.
The qualitative-quantitative method in use today is scientifically valid, offers effective solutions, but concerns only a set of the customers – those who have been analyzed, and this is its great limitation.
Mapping Customer Journeys: the data-driven approach to Customer Experience
To overcome the limits of traditional Customer Experience measurement, data-driven companies can employ Data Mining & Machine Learning applications. The innovative idea proposed and developed by Bip enables a new approach to map the Customer Experience and correlate it to business KPIs in a data-driven logic, through the collection and analysis of data on interactions between customers and corporate touchpoints.
These “user traces”, present on the company’s information systems, can therefore be processed with the use of Process Mining algorithms and be represented in graphical form (as process flows) obtaining a clear and complete picture of the map of the events that occurred during interaction with the company, in all the main Customer Journeys, also calculating simple operational KPIs (crossing times, event durations, repetitions, …).
Starting from these, it is possible to build more complex operational KPIs and set up a complete monitoring and control process flow. From the operational KPIs, finally, are inferred the correlation and the causality with the main KPIs of interest to the business.
The more complex the customer journeys, the variety and number of interactions and the customer behavioral patterns, the greater the value of leveraging our application.
A combined approach of evaluation and data analysis
All customer-company interaction processes have blind spots that data cannot detect: this is the limit of the data-driven method. The innovation of the combined approach between traditional research and data-driven investigation allows to overcome the limitations of both approaches, allowing the monitoring of a large number of users and allowing for the verticalization of surveys on circumscribed and limited areas. The research is guided on the areas that the data suggests to investigate: those with greatest value for the business or those that the data cannot describe.
Combining these two approaches allows us to take the best of both: have full awareness of all Customer Journeys, eliminate the dimension of arbitrariness linked to traditional methods, and therefore allow the business to intervene only and exclusively on real and well mapped customer paths.
For more information please refer to this insight on Experience Monitoring redacted by our colleagues from Sketchin.
Experience Mining: extracting experience from data
The Bip framework for mapping the Customer Experience starts from the collection of “traces” left by users on the systems during the interaction with the different physical or digital touchpoints: direct contacts – calls to the contact center, visits to the site / app, chat -, services activated or deactivated, products purchased, promotions activated, active communications from the company (eg. DEM, e-mail, …), physical channel contacts such as visits to the counter or in the store, CX surveys / surveys (eg. NPS , C-SAT, CES, …), etc.
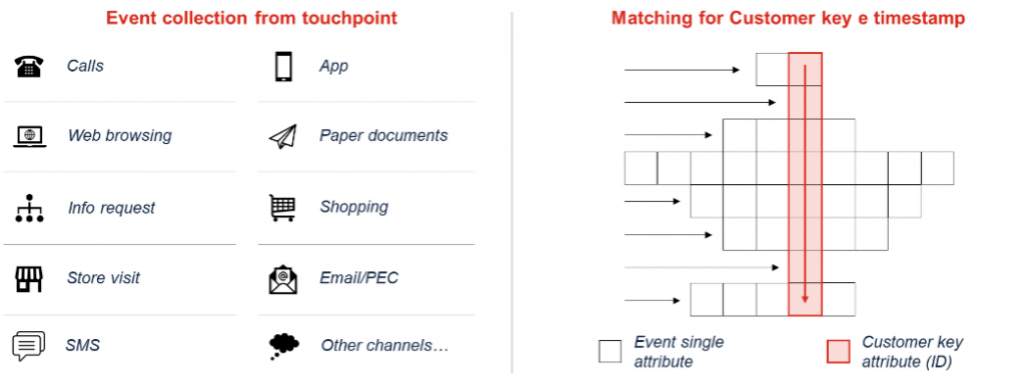
These events can be traced back to the individual customer by crossing the unique identifiers that characterize the interactions on the various data systems involved. These data often reside on different information systems, managed in silos by the different company departments, and therefore require pre-processing and cleansing actions in order to be linked as information of events relating to the same user.
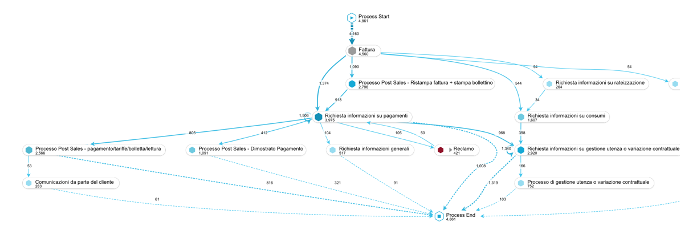
Once the data has been merged and brought back to the customer or prospect, the phase of reconstruction of the flow of activities starts using Process Mining technologies that enable a series of analysis functions, the most relevant of which are:
- graphically represent the flow diagram for the customer-company interaction process, the so-called “User Stories”, highlighting all the possible variations of the journey;
- define and quantitatively measure the KPIs of the customer’s processes;
- analyse performance on specific process KPIs and correlate these KPIs with the standard metrics of Customer Satisfaction measured throughout the process;
- define process and KPI graphical representation dashboards;
- filter the process by events and attributes of interest, allowing to identify distorted behaviours;
- perform root-cause analyses on specific events of interest to identify triggering factors and key events have a high impact, both positive and negative, on KPIs of interest.
The complexity of the mapping phase using Process Mining consists in managing a large multiplicity of “unique paths” undertaken by users in the interaction process. To solve this problem, Bip has created a proprietary Machine Learning module capable of performing a “behavioural clustering” on the chains of events that characterize the sequence of interactions between users and the company. In short, Bip algorithm detects groups of users who behave and interact with corporate touchpoints in a similar way (eg. who asks for the same types of information, through similar channels, …).
These segments of the customer base are the basis for building Customer Personas: fictional and archetypal characters who embody the behavior, habits, needs and expectations of a specific segment of real users. This categorization is also used as an additional information component to define specific KPIs for measuring the Customer Experience, which can be differentiated according to the behavioral model. The traditional evaluation of the Customer Experience starts from this point: Personas are the key to understanding the motivations and causes underlying user behavior.
The final step is to integrate the tool with the company information systems, thus allowing the company to be equipped with a Customer Experience monitoring system fed with constantly updated data so as to activate an iterative and continuous process of measurement, implementation of corrective measures targeted and guided by quantitative evidence, and finally monitoring the effectiveness.
Why Bip?
The Experience Mining framework has been successfully used on very different industries, for the analysis of different Customer processes. In fact, the approach is not focused on specific industries or processes, but can be used on any area and stage of the Customer Journey of a company’s customers.
We will now present two application examples, to describe their characteristics in a practical way.
Why do customers file complaints on bills for water, electricity and gas utilities?
The Bip asset of Experience Mining was used by a large Italian Utility to investigate the Customer Experience relating to the process of managing requests for information and post-invoicing commercial complaints in the field of water distribution, and the sale of electricity and gas .
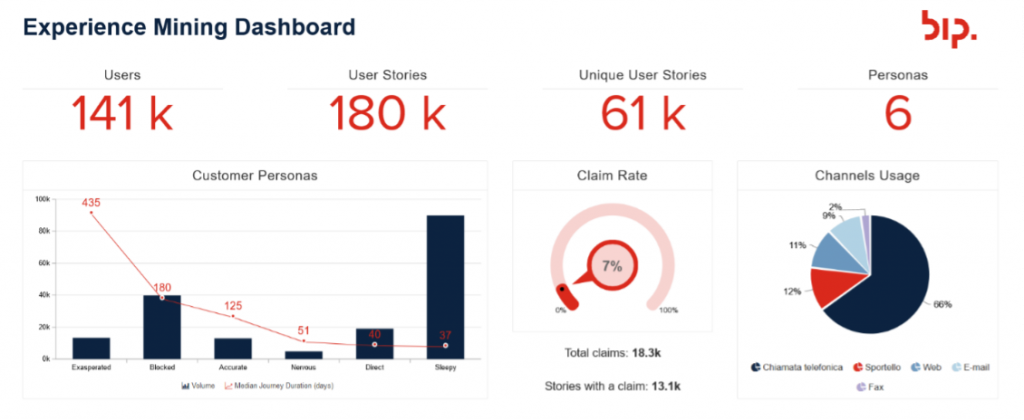
The BIP “behavioral clustering” algorithm allowed to segment the User Stories, downstream of the convergence with qualitative research insights, into 6 macro-clusters corresponding to as many Customer Personas, with different characteristics. This made it possible to automatically simplify the study on the entire monitored Customer Base, allowing to focus, instead of on 180,000 User Stories, only on 6 groups that represent the most relevant behaviors among all the users involved.
The evidence relating to each of the selected Personas, operated through the calculation of specific KPIs, made it possible to quickly define actions to improve the Customer Experience:
- Repetition rate of information requests: the most complaining customers are those with the highest rate of reiteration of information requests on the same problem, highlighting the need to create ad hoc support paths for this type of subject.
- Main channel for the management of information requests and for the resolution of requests for clarification on invoices: the most effective channel for managing problems has been identified for each group of users and strategies have been developed to direct them to this channel.
The quick wins implemented resulted in a decrease in the average complaint rate on the most problematic portions of the Customer Base.
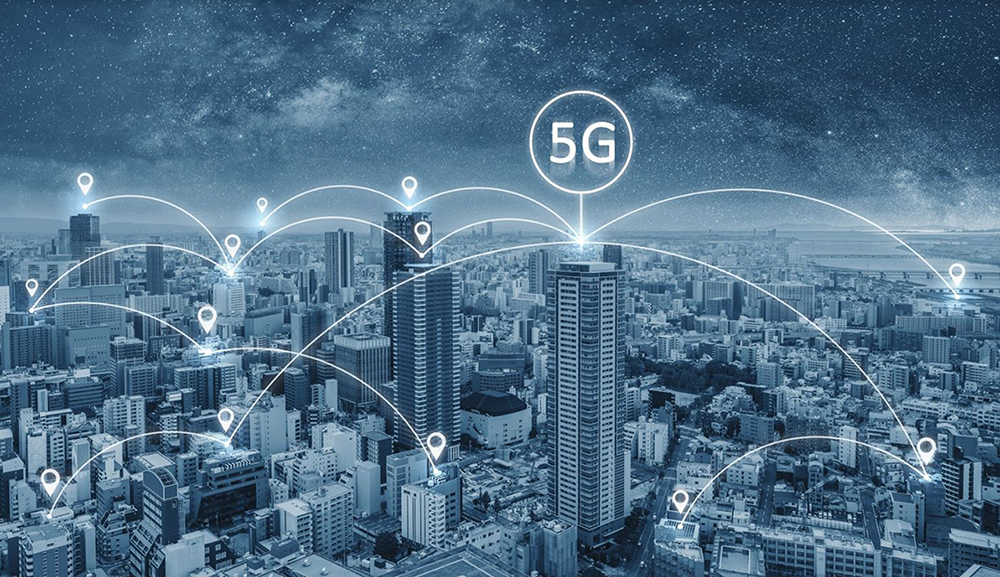
Why are customers churning from a telco service provisioning?
In Brazil, Bip helped a major telco player building an Experience Mining factory in order to enhance its capabilities of customer journey mapping and customer behaviour analytics. Until then, the company analytics teams had to deal with numerous and complex data sources, requiring many manual efforts to combine and consolidate so that they could generate relevant business insights. Manual data processing and representation was also turning customer journeys understanding (i.e. analyzing different sequences of events / interactions in a timeline) tremendously difficult.
In that sense, the Experience Mining implementation came with the following objectives:
- Facilitate data aggregation across multiple source systems (CRM, Digital Channels, Billing, Network platforms, etc…)
- Provide advanced analytics capabilities to get actionable insights based on customer journeys
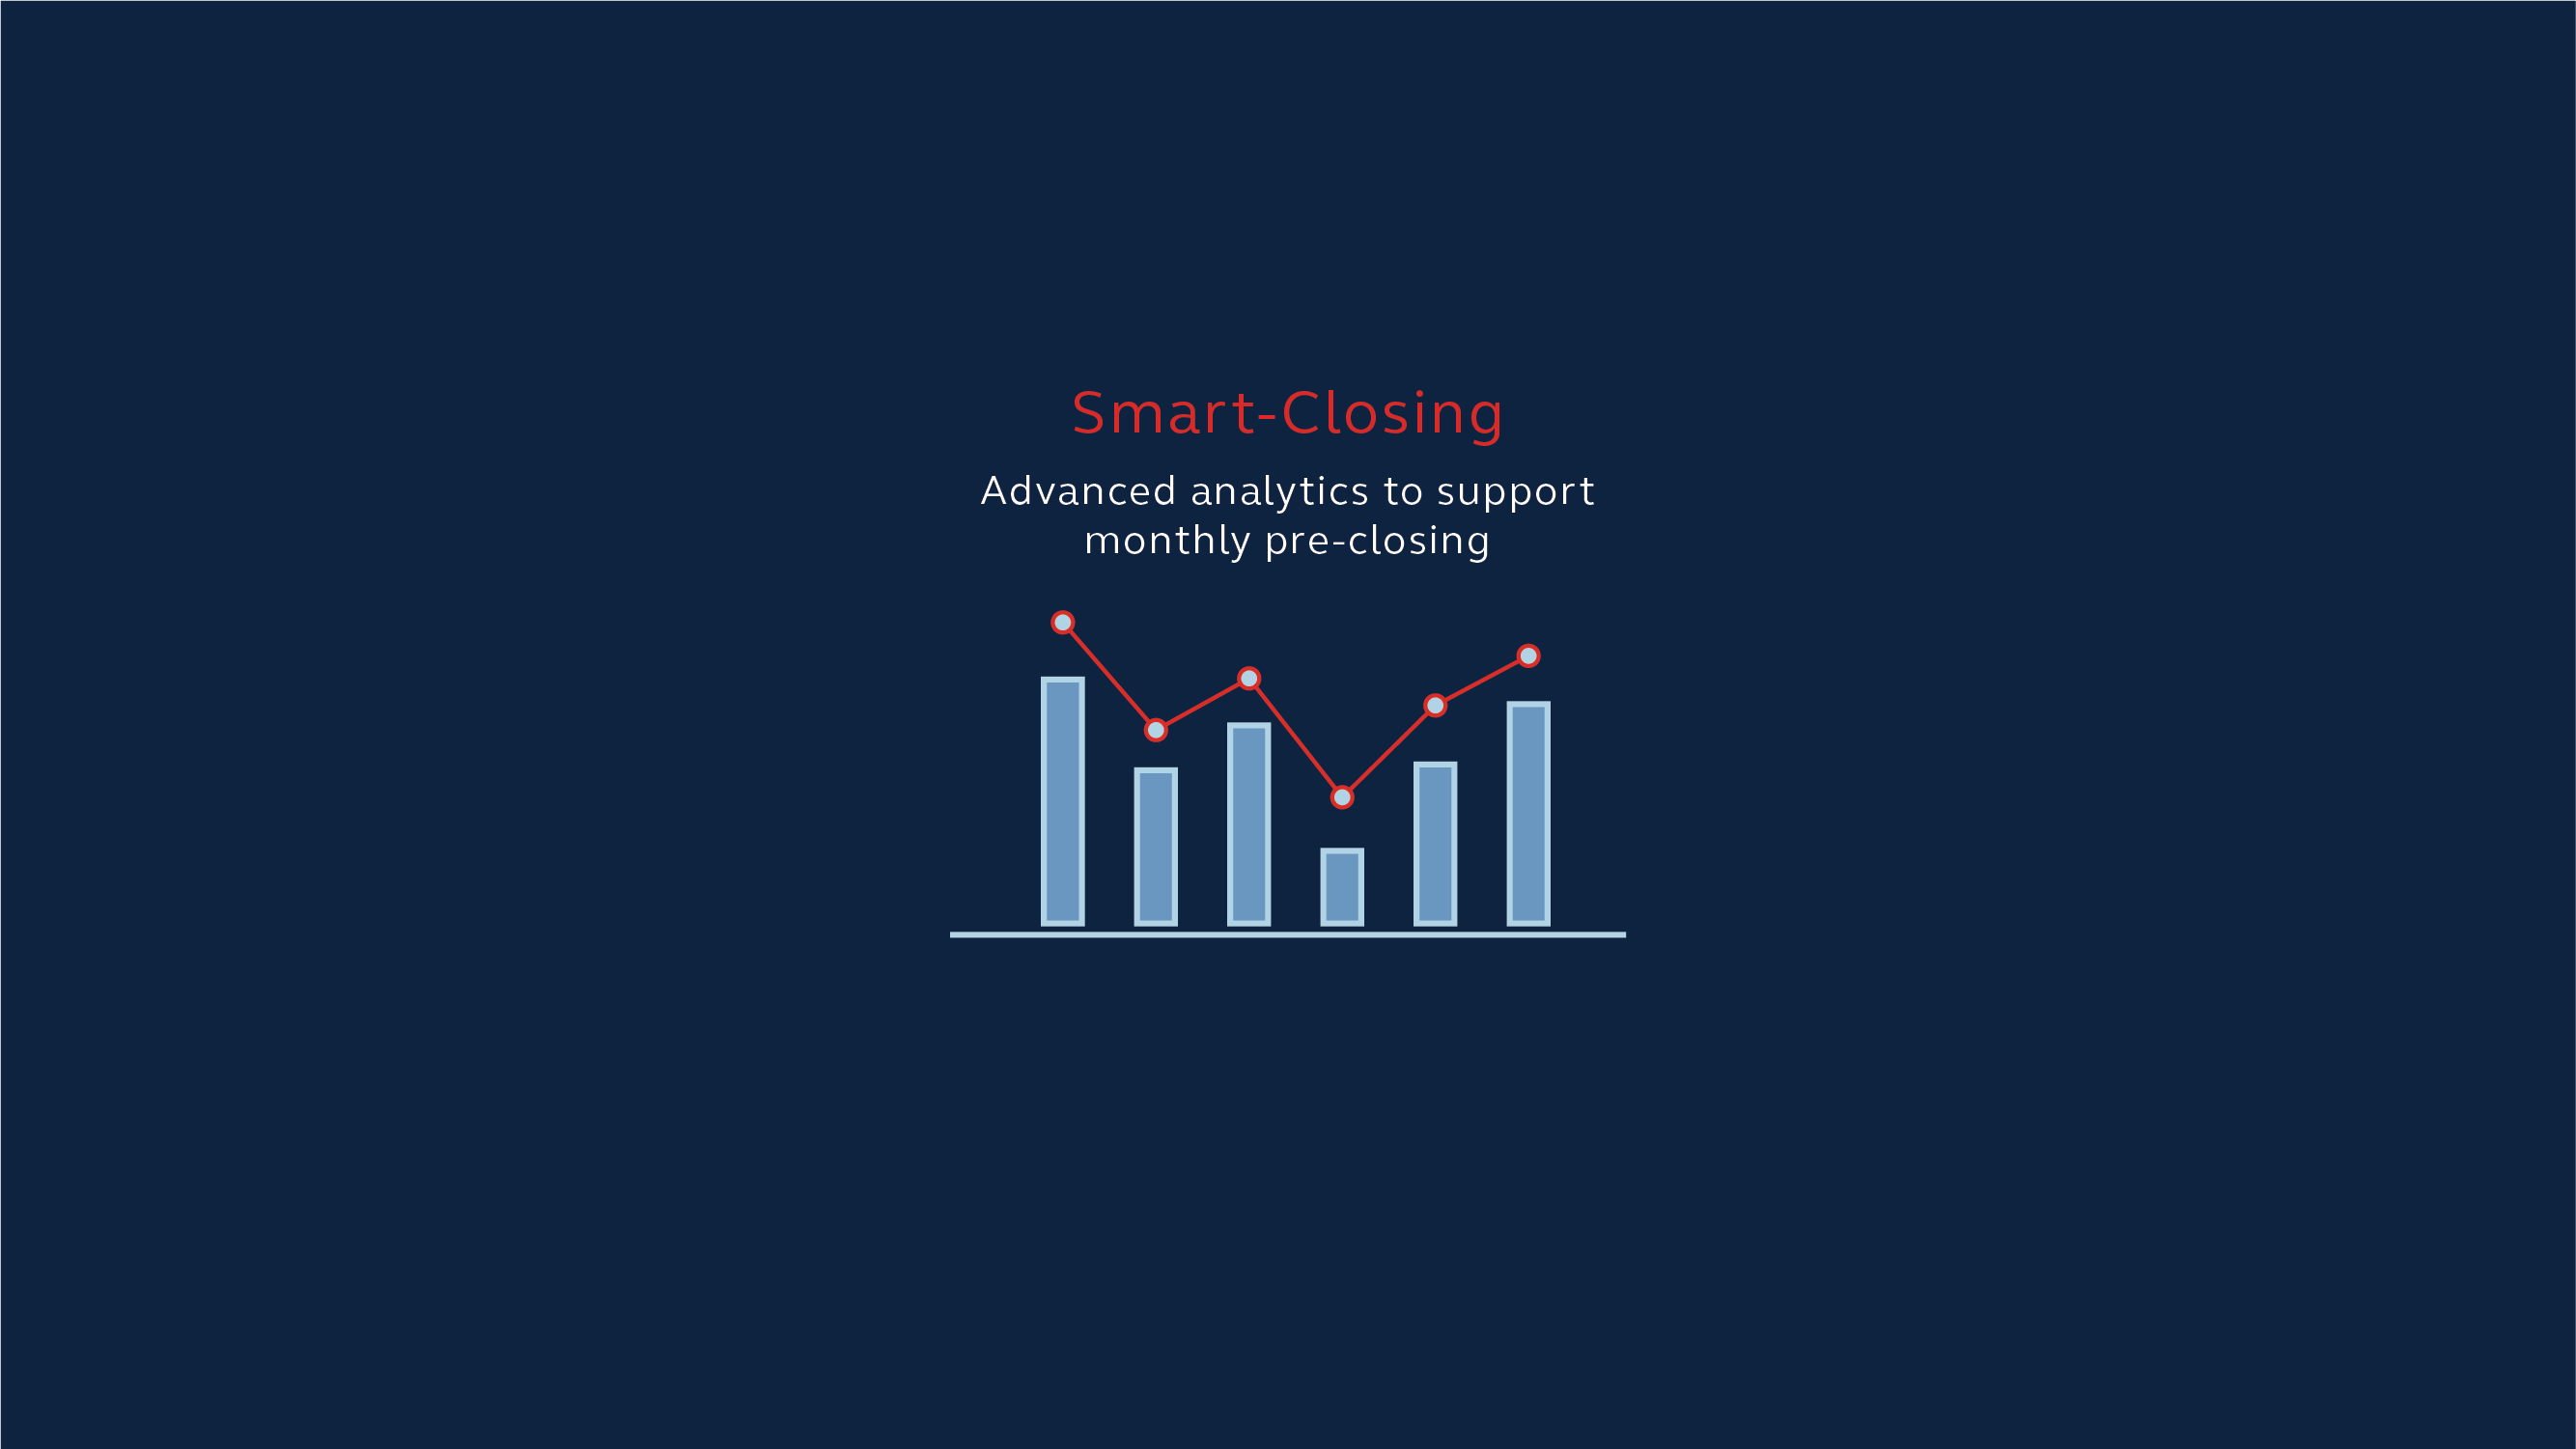
In terms of methodology, Bip implemented an “XMining Factory” using an agile treadmill so that it could deliver specific studies / analytics tools on a monthly basis. The product owner, defined on client’s side, was responsible for gathering hot topics & analysis needs internally (surveying boards of directors, other business areas, etc…), building and prioritizing the factory backlog.
Among the diverse use cases addressed by the factory, it is worth mentioning:
- A churn root-cause analysis module, allowing to better understand which kinds of variables (including the customer journey itself or even specific events of the journey) can affect the churn rate. The tool aggregates almost 20 different data sources and 500 variables, providing a user-friendly interface to experiment and observe correlations between the variables and churn rate. Using this module, Bip managed to identify a set of very specific scenarios of churning customers, based on their persona, consumption profile and journey, facilitating action plan definition.
- A Promoters vs Detractors study identifying which types of customer journeys (or specific events of theses journeys) were positively and negatively affecting the overall NPS score.
The Experience Mining asset is now available on the Celonis EMS Ecosystem. Check it out on the Celonis EMS Store to find out more on how our clients are improving their Customers’ Experience with Bip Experience Mining!
If you are interested in learning more about our offer or would like to have a conversation with one of our experts, please send an email to [email protected] with “Experience Mining” as subject, and you will be contacted promptly.
Leer más opiniones